 Demo project
Web app — 2026
Tideflow
- Services
- Design, Website
- Stack
- React · TypeScript · Tailwind CSS
- Year
- 2026
- Status
- Interactive demo
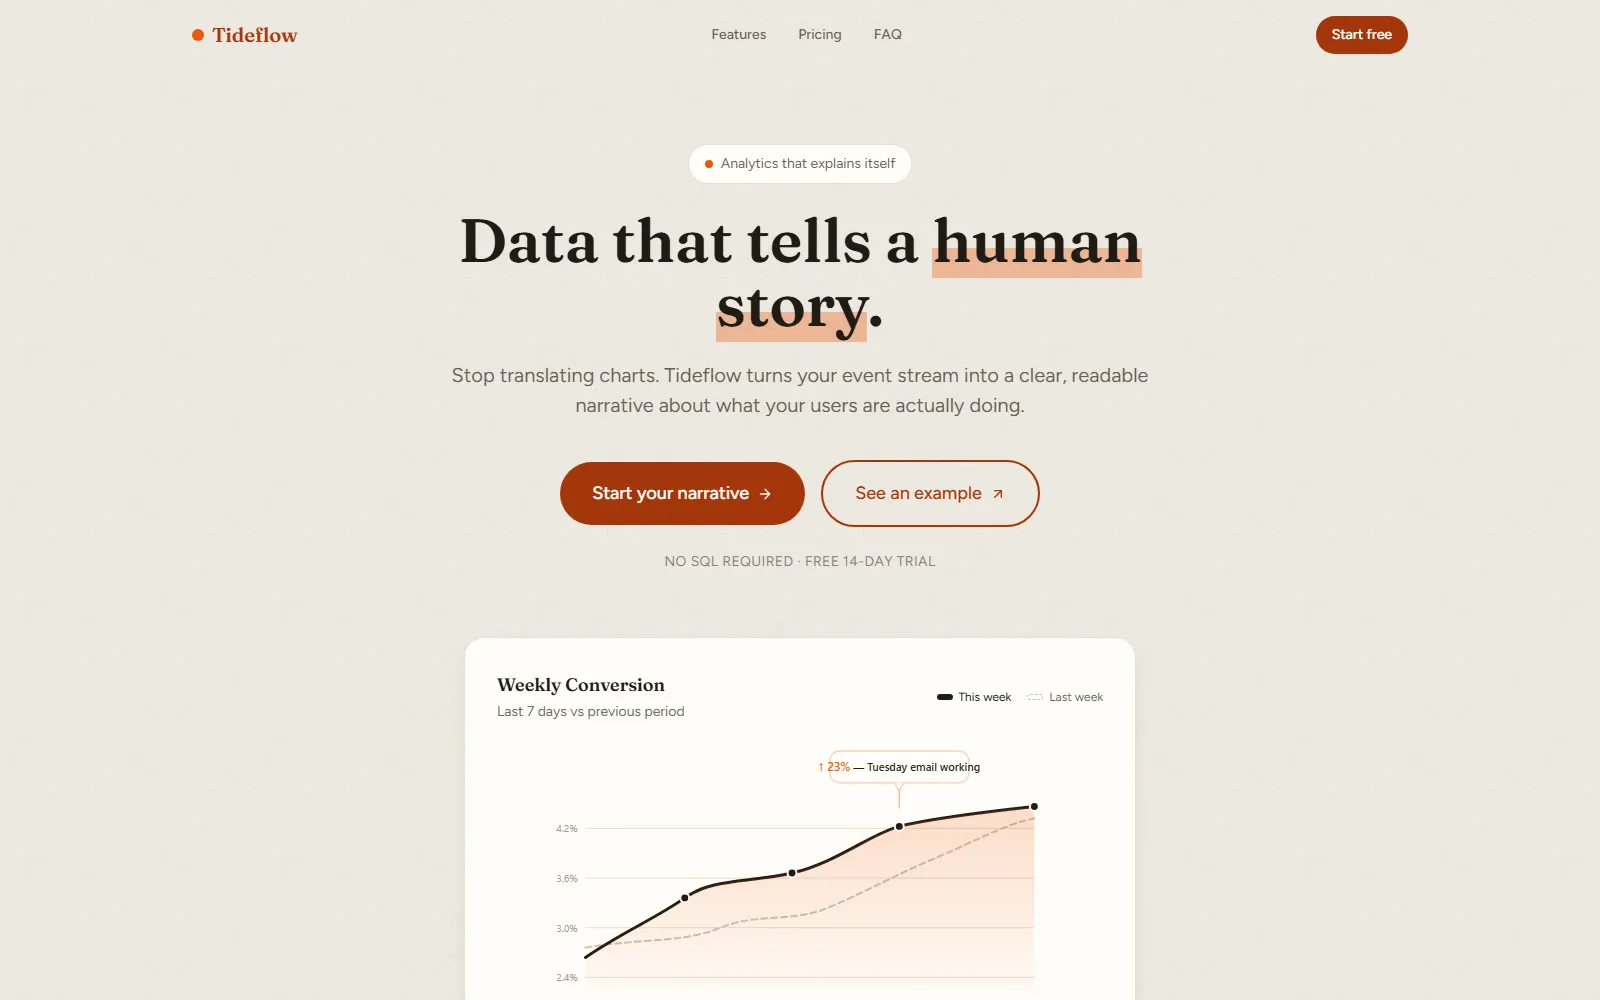
Tideflow is a fictional product demo exploring how analytics could turn event data into short, readable explanations instead of another wall of charts.
Open interactive demo01
The idea
Dashboards show you what changed but not why. A team sees a dip in a chart and starts guessing, or books a meeting about it. We wanted reports a non-analyst can read without help.
02
What we built
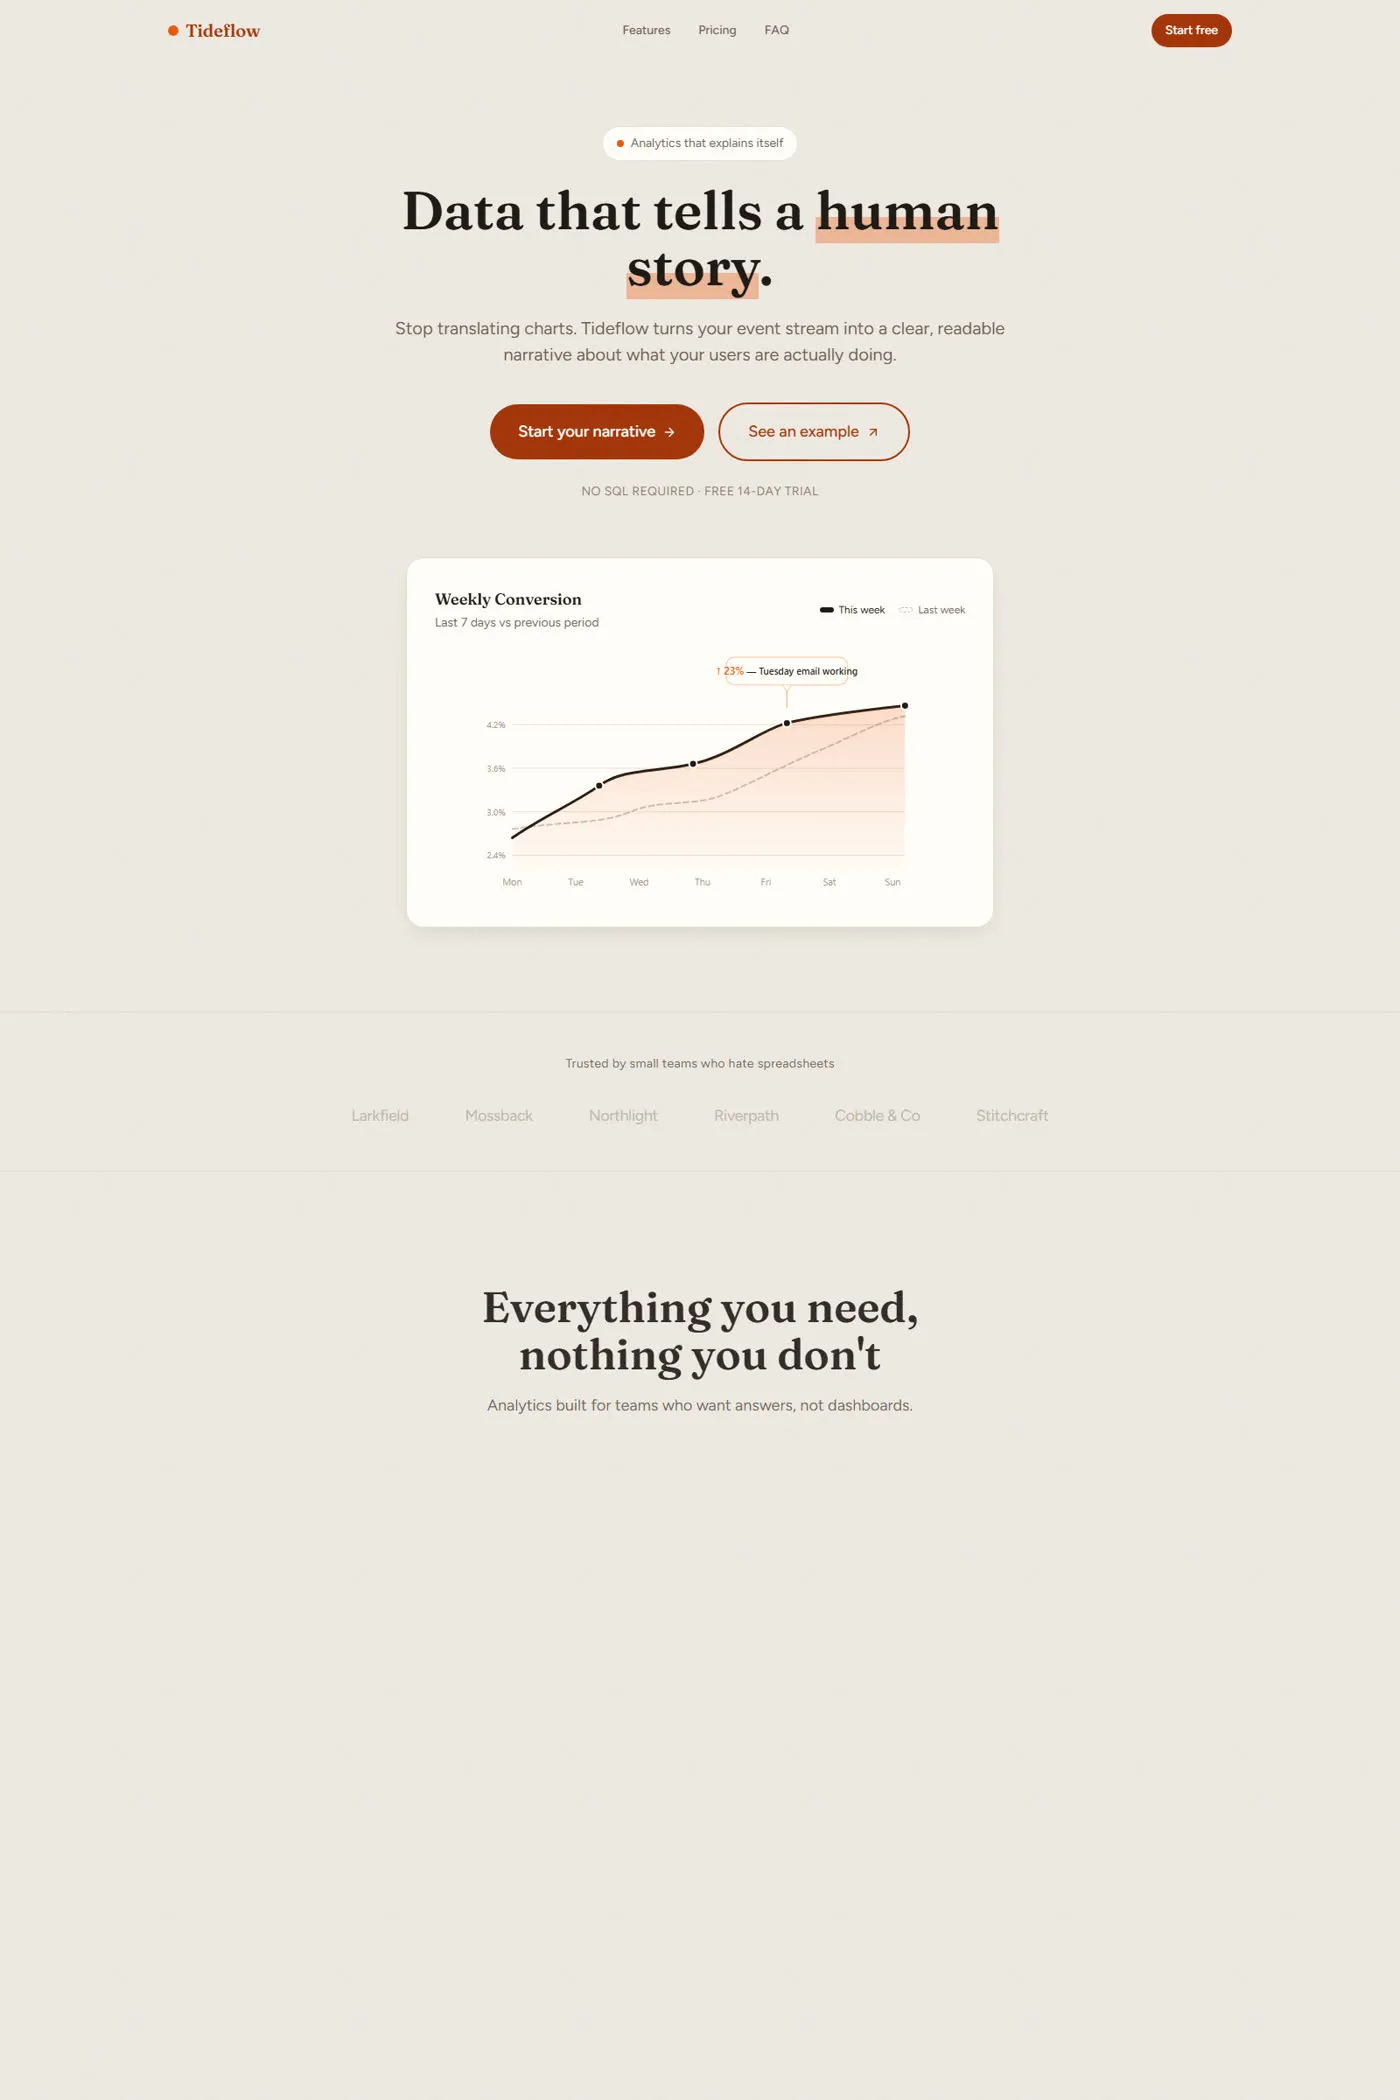
Every chart in Tideflow comes with a written explanation: what moved, what probably drove it, what to check next. The default view stays quiet until something is worth your attention.
What this demo shows
01Plain-language narratives attached to key metrics
02Prioritised signals instead of dashboard overload
03A focused interface designed for non-analysts
Tideflow is something we made for fun and practice. It is not client work and not a real product. You can click through the whole demo at tideflow.kraistudio.com.